 Matthew Weston
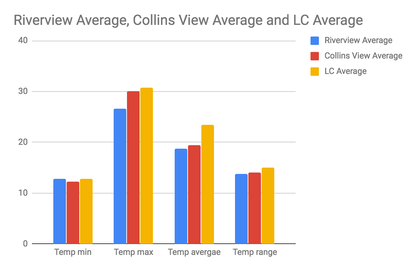
Lab Partner: Mackenzie Hoult 09/20/18 LUCC Analysis Analysis of ENVS 220 GLOBE Data This Lab has to due with the data recorded from previous labs in the Lewis and Clark Community. As stated here, our group recorded temperature, humidity, canopy cover, and ground cover from a residential home in the Collins View neighborhood. Other groups recorded data from different parts of Palatine Hill. In addition to the 4 groups in the Collins View community, there also was four groups in RVNA (River View Natural Area,) and four groups on the Lewis and Clark campus. After collecting the data in each group the information was entered into a document so everyone could access it and analyze the results. These procedures are similar to that of larger scale experiments done by Globe and others on a worldwide basis. Our specific site was centered on a tree in the back of a residential house in Collins View. Comparing our Collins View site to the other three sites in Collins View, our temperature min and temperature max stays within one to two degrees of all other sites. Our site in collins view stayed very similar to the overall temperature min and max averages of other collins view sites. Overall the 4 groups only had an average temperature range of .8 degrees whereas the average humidity had a range of 3.9. In order to compare all the average temperatures, you can refer to graph 1 below. Overall our site was close to the averages from all 4 locations. This makes sense because they are all in a relatively similar weather area. In terms of humidity min, our site in collins view had a lower min humidity then most other sites by about 3 degrees celsius as shown in table 2. With an exception of the sites in RVNA who are had an additional 14 degrees celcius to the min average humidity. The maximum humidity stays within about 1-2 degrees celcius from our collins view location. Overall the three locations lay in fairly close vicinity to one another (a one mile radius) so the average data points all were very similar. Graph 1: Table 2: Average Humidity River View 61.475 Collins View 59.025 Lewis and Clark 57.65 The largest change was RVNA compared to Lewis and Clark or Collins View. Temperature tended to remain slightly colder in the more canopied area. Lewis and Clark as well as Collins view had Canopy cover of 40 and 47%, as you can read from table 3 below. RVNA nearly doubled that with 82% canopy cover. Table 3: Average Percent Canopy cover Collins view 47.5 RVNA 82.6875 Lewis and Clark 40.2 RVNA also had 92% ground cover compared to the mere 43% in Collins View and 56% at Lewis and Clark. RVNA had the lowest temperature max by 4 degrees celsius. This could be due to the large amount of land cover on the property. Unlike Collins View and Lewis and Clark, RVNA has not been altered to the same extent since 1939. From the aerial photograph the residential and college areas have had their canopies and ground cover change. Instead of dirt and shrubs concrete and asphalt has taken over much of the ground cover. Due to this change canopy is also removed forming roads, lawns, and buildings. Collins View has a lot of the same land characteristics as Lewis and Clark’s campus making the similar data results somewhat unsurprising. In order to gain a better understanding of the similarities and differences, especially between Lewis and Clark and Collins View, more data points should be taken. Additionally more references to how the land has changed could help us look at why the data may have changed between the three locations.
0 Comments
Leave a Reply. |
AuthorWrite something about yourself. No need to be fancy, just an overview. Archives
December 2018
Categories |
 RSS Feed
