Capitalocene Lab 3
Over the past two weeks we have been examining the Capitalocene using world data in ENVS 220. The Capitalocene looks at how a country may respond differently to their impact on nature due to the economic standing of the community.Through analyzing EPI and World country data looking at how different countries environmental standards and goals compare to the level of development economically the country has gone through. For this lab, we used the World Values Survey to look at how the Capitalocene may explain significant environmental values and beliefs among people from country to country. We assume the views shared will be related to each countries correlating environmental practices. This was measure in previous labs through Yale’s EPI standards. This survey is yet another point of data to look at changes to the environment that may occur based on the economic standing of a country or region.
We first selected three countries we wanted to look at in the World values survey, one of each income group. We chose Haiti (low income), Algeria (Middle income) and Argentina (High income). We extracted each of these countries data from the world values survey and picked a variable, or specific survey question, we wanted to look at. We chose protecting the Environment v.s Economic growth, with a 1 representing a priority for protecting the environment even if it causes slower economic growth and some loss of jobs, and a 2 representing a priority on economic growth and creating jobs even if the environment suffers. Graphing each countries response to this question, we made a histogram in order to look at the number of responses in comparison to whether the majority of the responses were 1, a priority for protecting the environment even if it causes slower economic growth and some loss of jobs, or 2, representing a priority on economic growth and creating jobs even if the environment suffers. From there, we calculated the average and standard deviation for all three countries to better map the varying degree of responses from each country and look for trends. From this information we came up with a hypothesis. This is because in order to later find a null hypothesis and do successful t-tests they will need to be based on this hypothesis. Our hypothesis stated, the lower the countries income the higher they’ll prioritize economic growth over environmental protection. To find a p variable to compare the data we had to do a t-test for each country, i.e Haiti v.s Algeria, Haiti v.s Argentina and Argentina v.s Algeria. Our null hypothesis stated, the higher the countries income the lower they’ll prioritize environmental protection. We calculated the p-value for each set of countries, and found they were very small, coming out as less than .01. As you can see in the analysis portion, these very small P-values make sense because of our huge sample size for each country. After we found this, we compared our values in order to decide if we should reject or discard our null hypothesis.
Countries
P value
Haiti and Algeria
P>.01
Haiti and Algeria
P>.01
Argentina and Algeria
P>.01
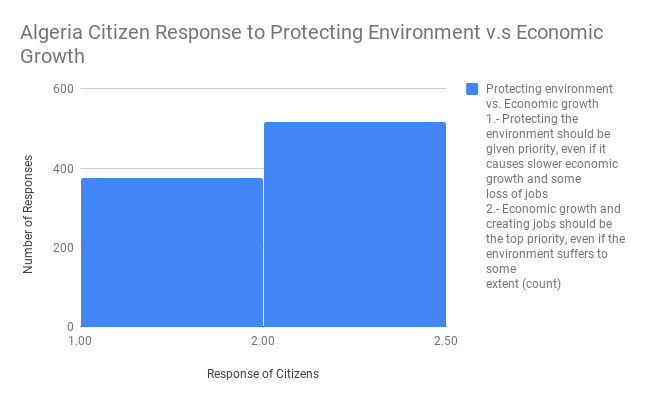
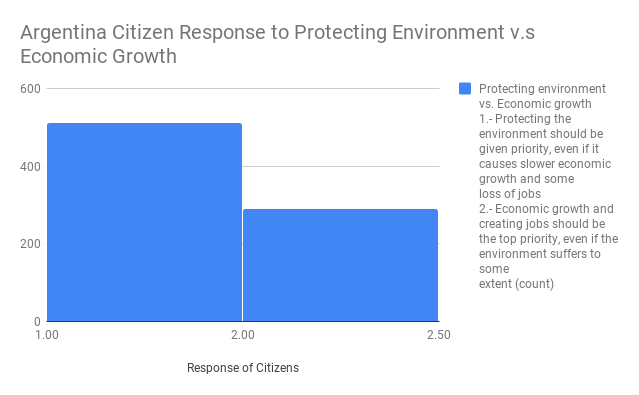
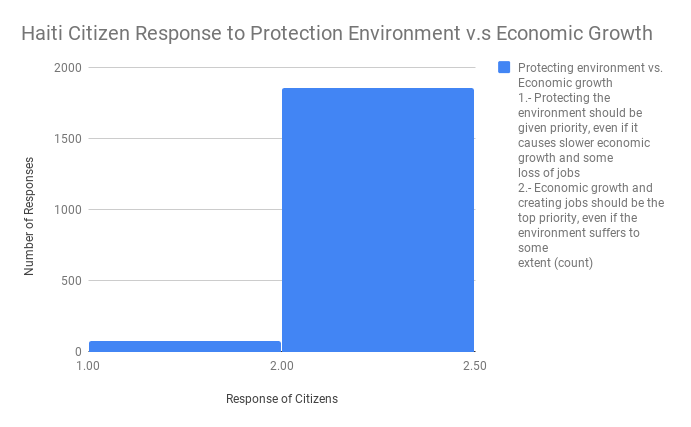
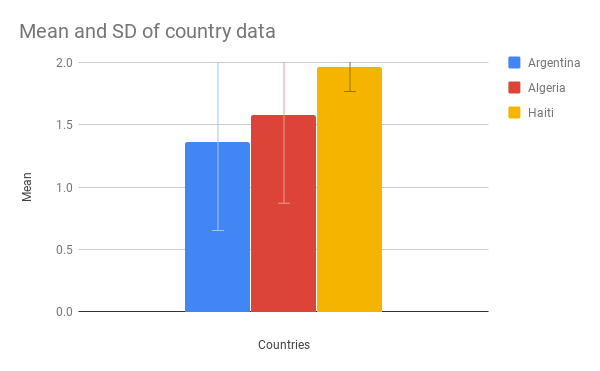
Above we have three histograms are showing the responses (either 1 or 2) of the citizens of each country. The responses show that the higher income level of these three countries the more citizens answer 1 rather than 2. The graph shows each countries average response to the poll. This means that the lower the average the more people answered in favor on the environment over economy. The error bars indicate the standard deviation of responses. Each of our p values also fell below .01 supporting our data.
These findings further back up my hypothesis that the more weather an area the higher emphasis they put on environmental health. In our results you can see that Argentina was the most concerned over environmental health followed by Algeria, then Haiti. From my past labs, I have seen similar results. In lab one my results suggested that higher income regions also had higher EPI scores. I was hesitant to link these to the capitalocene however due to the EPI being based off of performance goals rather than values. In lab 2 I compared urban growth with % area forest finding that countries that grew the most urbanely also decreased their forest size. These countries also tended to be low income regions. The data in this lab too shows that there may be a correlation to attitudes around the environment based off of income levels. The higher income of the country the larger the emphasis put on environment was compared to the economic importance in their communities. It seems as though there is a trend in that the better and more stable the economy may mean that people can focus more on other issues such as the environment.
These findings further back up my hypothesis that the more weather an area the higher emphasis they put on environmental health. In our results you can see that Argentina was the most concerned over environmental health followed by Algeria, then Haiti. From my past labs, I have seen similar results. In lab one my results suggested that higher income regions also had higher EPI scores. I was hesitant to link these to the capitalocene however due to the EPI being based off of performance goals rather than values. In lab 2 I compared urban growth with % area forest finding that countries that grew the most urbanely also decreased their forest size. These countries also tended to be low income regions. The data in this lab too shows that there may be a correlation to attitudes around the environment based off of income levels. The higher income of the country the larger the emphasis put on environment was compared to the economic importance in their communities. It seems as though there is a trend in that the better and more stable the economy may mean that people can focus more on other issues such as the environment.
